搞了两个星期的Prometheus,记录一下配置文件与一些细节
看这篇文章的,我就当你已经有k8s和Prometheus的基础了
先吐槽官网,示例太少了
首先为了我们自己区分,先创建一个namespace,这里我叫monitor
kubectl create namespace monitor
因为这里通过kube-state-metrics来从Kubernetes API服务器和节点获取指标,所以需要k8s的授权
授权yml文件链接地址,请自行下载到服务器上 这里也坑了我不少时间- -,才发现有现成的
kubectl apply -f kubernetes
暂时没有挂载数据盘~所以重启数据就没了哈哈哈哈哈
yaml奉上~ 官方模板
---
apiVersion: v1
kind: ConfigMap
metadata:
  name: prometheus-conf
  namespace: monitor
  labels:
    app: prometheus
data:
  prometheus.yml: |-
    # my global config
    global:
      scrape_interval: 15s #15s采集一次数据,默认值为1分钟
      evaluation_interval: 15s #15s评估一下规则,默认值为1分钟
      # scrape_timeout is set to the global default (10s).

    #采用alertmanager聚合,发送告警
    alerting:
      alertmanagers:
      - static_configs:
        - targets:
           - alertmanager:9093

    #加载告警规则的路径,并在evaluation_interval时间内,定期进行评估
    #可以写文件,可以写目录,这里我把规则进行多个文件拆分,所以写的目录
    rule_files:
      - "/etc/prometheus/rules/*.yml"
      # - "first_rules.yml"

    # A scrape configuration containing exactly one endpoint to scrape:
    # Here it's Prometheus itself.
    scrape_configs:
      # The job name is added as a label `job=<job_name>` to any timeseries scraped from this config.
      #监控Prometheus本身
      - job_name: 'prometheus'

        # metrics_path defaults to '/metrics'
        # scheme defaults to 'http'.

        static_configs:
          - targets: ['localhost:9090']

      #监控grafana
      - job_name: 'grafana'
        static_configs:
          - targets:
              - 'grafana-service.monitor:3000'

      - job_name: 'kubernetes-apiservers'

        kubernetes_sd_configs:
        - role: endpoints

        # Default to scraping over https. If required, just disable this or change to
        # `http`.
        scheme: https

        # This TLS & bearer token file config is used to connect to the actual scrape
        # endpoints for cluster components. This is separate to discovery auth
        # configuration because discovery & scraping are two separate concerns in
        # Prometheus. The discovery auth config is automatic if Prometheus runs inside
        # the cluster. Otherwise, more config options have to be provided within the
        # <kubernetes_sd_config>.
        tls_config:
          ca_file: /var/run/secrets/kubernetes.io/serviceaccount/ca.crt
          # If your node certificates are self-signed or use a different CA to the
          # master CA, then disable certificate verification below. Note that
          # certificate verification is an integral part of a secure infrastructure
          # so this should only be disabled in a controlled environment. You can
          # disable certificate verification by uncommenting the line below.
          #
          # insecure_skip_verify: true
        bearer_token_file: /var/run/secrets/kubernetes.io/serviceaccount/token

        # Keep only the default/kubernetes service endpoints for the https port. This
        # will add targets for each API server which Kubernetes adds an endpoint to
        # the default/kubernetes service.
        relabel_configs:
        - source_labels: [__meta_kubernetes_namespace, __meta_kubernetes_service_name, __meta_kubernetes_endpoint_port_name]
          action: keep
          regex: default;kubernetes;https

      # Scrape config for nodes (kubelet).
      #
      # Rather than connecting directly to the node, the scrape is proxied though the
      # Kubernetes apiserver.  This means it will work if Prometheus is running out of
      # cluster, or can't connect to nodes for some other reason (e.g. because of
      # firewalling).
      - job_name: 'kubernetes-nodes'

        # Default to scraping over https. If required, just disable this or change to
        # `http`.
        scheme: https

        # This TLS & bearer token file config is used to connect to the actual scrape
        # endpoints for cluster components. This is separate to discovery auth
        # configuration because discovery & scraping are two separate concerns in
        # Prometheus. The discovery auth config is automatic if Prometheus runs inside
        # the cluster. Otherwise, more config options have to be provided within the
        # <kubernetes_sd_config>.
        tls_config:
          ca_file: /var/run/secrets/kubernetes.io/serviceaccount/ca.crt
        bearer_token_file: /var/run/secrets/kubernetes.io/serviceaccount/token

        kubernetes_sd_configs:
        - role: node

        relabel_configs:
        - action: labelmap
          regex: __meta_kubernetes_node_label_(.+)
        - target_label: __address__
          replacement: kubernetes.default.svc:443
        - source_labels: [__meta_kubernetes_node_name]
          regex: (.+)
          target_label: __metrics_path__
          replacement: /api/v1/nodes/${1}/proxy/metrics

      # Scrape config for Kubelet cAdvisor.
      #
      # This is required for Kubernetes 1.7.3 and later, where cAdvisor metrics
      # (those whose names begin with 'container_') have been removed from the
      # Kubelet metrics endpoint.  This job scrapes the cAdvisor endpoint to
      # retrieve those metrics.
      #
      # In Kubernetes 1.7.0-1.7.2, these metrics are only exposed on the cAdvisor
      # HTTP endpoint; use "replacement: /api/v1/nodes/${1}:4194/proxy/metrics"
      # in that case (and ensure cAdvisor's HTTP server hasn't been disabled with
      # the --cadvisor-port=0 Kubelet flag).
      #
      # This job is not necessary and should be removed in Kubernetes 1.6 and
      # earlier versions, or it will cause the metrics to be scraped twice.
      - job_name: 'kubernetes-cadvisor'

        # Default to scraping over https. If required, just disable this or change to
        # `http`.
        scheme: https

        # This TLS & bearer token file config is used to connect to the actual scrape
        # endpoints for cluster components. This is separate to discovery auth
        # configuration because discovery & scraping are two separate concerns in
        # Prometheus. The discovery auth config is automatic if Prometheus runs inside
        # the cluster. Otherwise, more config options have to be provided within the
        # <kubernetes_sd_config>.
        tls_config:
          ca_file: /var/run/secrets/kubernetes.io/serviceaccount/ca.crt
        bearer_token_file: /var/run/secrets/kubernetes.io/serviceaccount/token

        kubernetes_sd_configs:
        - role: node

        relabel_configs:
        - action: labelmap
          regex: __meta_kubernetes_node_label_(.+)
        - target_label: __address__
          replacement: kubernetes.default.svc:443
        - source_labels: [__meta_kubernetes_node_name]
          regex: (.+)
          target_label: __metrics_path__
          replacement: /api/v1/nodes/${1}/proxy/metrics/cadvisor

      # Scrape config for service endpoints.
      #
      # The relabeling allows the actual service scrape endpoint to be configured
      # via the following annotations:
      #
      # * `prometheus.io/scrape`: Only scrape services that have a value of `true`
      # * `prometheus.io/scheme`: If the metrics endpoint is secured then you will need
      # to set this to `https` & most likely set the `tls_config` of the scrape config.
      # * `prometheus.io/path`: If the metrics path is not `/metrics` override this.
      # * `prometheus.io/port`: If the metrics are exposed on a different port to the
      # service then set this appropriately.
      - job_name: 'kubernetes-service-endpoints'

        kubernetes_sd_configs:
        - role: endpoints

        relabel_configs:
        - source_labels: [__meta_kubernetes_service_annotation_prometheus_io_scrape]
          action: keep
          regex: true
        - source_labels: [__meta_kubernetes_service_annotation_prometheus_io_scheme]
          action: replace
          target_label: __scheme__
          regex: (https?)
        - source_labels: [__meta_kubernetes_service_annotation_prometheus_io_path]
          action: replace
          target_label: __metrics_path__
          regex: (.+)
        - source_labels: [__address__, __meta_kubernetes_service_annotation_prometheus_io_port]
          action: replace
          target_label: __address__
          regex: ([^:]+)(?::\d+)?;(\d+)
          replacement: $1:$2
        - action: labelmap
          regex: __meta_kubernetes_service_label_(.+)
        - source_labels: [__meta_kubernetes_namespace]
          action: replace
          target_label: kubernetes_namespace
        - source_labels: [__meta_kubernetes_service_name]
          action: replace
          target_label: kubernetes_name

      # Example scrape config for probing services via the Blackbox Exporter.
      #
      # The relabeling allows the actual service scrape endpoint to be configured
      # via the following annotations:
      #
      # * `prometheus.io/probe`: Only probe services that have a value of `true`
      - job_name: 'kubernetes-services'

        metrics_path: /probe
        params:
          module: [http_2xx]

        kubernetes_sd_configs:
        - role: service

        relabel_configs:
        - source_labels: [__meta_kubernetes_service_annotation_prometheus_io_probe]
          action: keep
          regex: true
        - source_labels: [__address__]
          target_label: __param_target
        - target_label: __address__
          replacement: blackbox-exporter.example.com:9115
        - source_labels: [__param_target]
          target_label: instance
        - action: labelmap
          regex: __meta_kubernetes_service_label_(.+)
        - source_labels: [__meta_kubernetes_namespace]
          target_label: kubernetes_namespace
        - source_labels: [__meta_kubernetes_service_name]
          target_label: kubernetes_name

      # Example scrape config for probing ingresses via the Blackbox Exporter.
      #
      # The relabeling allows the actual ingress scrape endpoint to be configured
      # via the following annotations:
      #
      # * `prometheus.io/probe`: Only probe services that have a value of `true`
      - job_name: 'kubernetes-ingresses'

        metrics_path: /probe
        params:
          module: [http_2xx]

        kubernetes_sd_configs:
          - role: ingress

        relabel_configs:
          - source_labels: [__meta_kubernetes_ingress_annotation_prometheus_io_probe]
            action: keep
            regex: true
          - source_labels: [__meta_kubernetes_ingress_scheme,__address__,__meta_kubernetes_ingress_path]
            regex: (.+);(.+);(.+)
            replacement: ${1}://${2}${3}
            target_label: __param_target
          - target_label: __address__
            replacement: blackbox-exporter.example.com:9115
          - source_labels: [__param_target]
            target_label: instance
          - action: labelmap
            regex: __meta_kubernetes_ingress_label_(.+)
          - source_labels: [__meta_kubernetes_namespace]
            target_label: kubernetes_namespace
          - source_labels: [__meta_kubernetes_ingress_name]
            target_label: kubernetes_name

      # Example scrape config for pods
      #
      # The relabeling allows the actual pod scrape endpoint to be configured via the
      # following annotations:
      #
      # * `prometheus.io/scrape`: Only scrape pods that have a value of `true`
      # * `prometheus.io/path`: If the metrics path is not `/metrics` override this.
      # * `prometheus.io/port`: Scrape the pod on the indicated port instead of the
      # pod's declared ports (default is a port-free target if none are declared).

      - job_name: 'kubernetes-pods'

        kubernetes_sd_configs:
        - role: pod

        relabel_configs:
        - source_labels: [__meta_kubernetes_pod_annotation_prometheus_io_scrape]
          action: keep
          regex: true
        - source_labels: [__meta_kubernetes_pod_annotation_prometheus_io_path]
          action: replace
          target_label: __metrics_path__
          regex: (.+)
        - source_labels: [__address__, __meta_kubernetes_pod_annotation_prometheus_io_port]
          action: replace
          regex: ([^:]+)(?::\d+)?;(\d+)
          replacement: $1:$2
          target_label: __address__
        - action: labelmap
          regex: __meta_kubernetes_pod_label_(.+)
        - source_labels: [__meta_kubernetes_namespace]
          action: replace
          target_label: kubernetes_namespace
        - source_labels: [__meta_kubernetes_pod_name]
          action: replace
          target_label: kubernetes_pod_name


       #自定义采集的java信息
      - job_name: 'java-pods'
        kubernetes_sd_configs:
        - role: pod
        relabel_configs:
        - source_labels: [__meta_kubernetes_namespace]
          regex: test-t3
          action: keep
        - source_labels: [__metrics_path__]
          action: replace
          replacement: /ops/prometheus
          target_label: __metrics_path__
        - source_labels: [__address__]
          action: replace
          replacement: $1:9999
          target_label: __address__
        - source_labels: [__meta_kubernetes_pod_name]
          action: replace
          target_label: kubernetes_pod_name

       #grafana会用到 后面介绍
      - job_name: 'kubernetes-kubelet'
        scheme: https
        tls_config:
          ca_file: /var/run/secrets/kubernetes.io/serviceaccount/ca.crt
          insecure_skip_verify: true
        bearer_token_file: /var/run/secrets/kubernetes.io/serviceaccount/token
        kubernetes_sd_configs:
        - role: node
        relabel_configs:
        - action: labelmap
          regex: __meta_kubernetes_node_label_(.+)
        - target_label: __address__
          replacement: kubernetes.default.svc:443
        - source_labels: [__meta_kubernetes_node_name]
          regex: (.+)
          target_label: __metrics_path__
          replacement: /api/v1/nodes/${1}/proxy/metrics

        - job_name: 'kubernetes-kube-state'
          kubernetes_sd_configs:
          - role: pod
          relabel_configs:
          - action: labelmap
            regex: __meta_kubernetes_pod_label_(.+)
          - source_labels: [__meta_kubernetes_namespace]
            action: replace
            target_label: kubernetes_namespace
          - source_labels: [__meta_kubernetes_pod_name]
            action: replace
            target_label: kubernetes_pod_name
          - source_labels: [__meta_kubernetes_pod_label_grafanak8sapp]
            regex: .*true.*
            action: keep
          - source_labels: ['__meta_kubernetes_pod_label_daemon', '__meta_kubernetes_pod_node_name']
            regex: 'node-exporter;(.*)'
            action: replace
            target_label: nodename
---
apiVersion: v1
kind: ConfigMap
metadata:
  name: prometheus-rules
  namespace: monitor
  labels:
    app: prometheus
data:                        #报警规则这边只是写了个示例,也是坑了我很长时间的报警抑制示例
  cpu-usage.rule: |
   groups:
     - name: NodeUsage
       rules:
         - alert: NodeCPUUsage 70%
           expr: floor((100 - (avg by (kubernetes_pod_name) (irate(node_cpu{kubernetes_pod_name=~"node-.*",mode="idle"}[5m])) * 100))) > 70
           for: 1m
           labels:
             level: "9"
             equal: "NodeCPUUsage"
           annotations:
             summary: "CPU 使用率"
             description: "%"
         - alert: NodeCPUUsage 90%
           expr: floor((100 - (avg by (kubernetes_pod_name) (irate(node_cpu{kubernetes_pod_name=~"node-.*",mode="idle"}[5m])) * 100))) > 90
           for: 1m
           labels:
             level: "10"
             equal: "NodeCPUUsage"
           annotations:
             summary: "CPU 使用率"
             description: "%"

---
apiVersion: apps/v1beta2
kind: Deployment
metadata:
  name: prom
  labels:
    app: prom
spec:
  replicas: 1
  selector:
    matchLabels:
      app: prom
  template:
    metadata:
      labels:
        app: prom
    spec:
      containers:
        - name: prom
          image: 'prom/prometheus:latest'
          imagePullPolicy: Always
          env:
            - name: TZ
              value: Asia/Shanghai
          resources:
            limits:
              cpu: '1'
              memory: 1024Mi
          volumeMounts:
            - name: volume-1542629114333
              mountPath: /etc/prometheus/prometheus.yml
              subPath: prometheus.yml
            - name: volume-1542629123938
              mountPath: /etc/prometheus/rules
      volumes:
        - name: volume-1542629114333
          configMap:
            name: prometheus-conf
        - name: volume-1542629123938
          configMap:
            name: prometheus-rules
AlertManager用于接收Prometheus发送的告警并对于告警进行一系列的处理后发送出去~这里是用的webhook,然后发送给钉钉
记得,他的报警和恢复是可以在一条消息内发送的!!!!!!!!!!!!!!!
yaml奉上~
---
apiVersion: apps/v1beta2
kind: Deployment
metadata:
  name: alertmanager
  labels:
    app: alertmanager
spec:
  replicas: 1
  selector:
    matchLabels:
      app: alertmanager
  template:
    metadata:
      labels:
        app: alertmanager
    spec:
      containers:
        - name: alertmanager
          image: 'quay.io/prometheus/alertmanager:latest'
          imagePullPolicy: Always
          resources:
            limits:
              cpu: '500'
              memory: 500Mi
          volumeMounts:
            - name: volume-1542631033312
              mountPath: /etc/alertmanager/
      volumes:
        - name: volume-1542631033312
          configMap:
            name: alertmanager
AlertManager 配置文件在这!一个多级抑制 也搞了很长时间
global:
  resolve_timeout: 5m
route:
  receiver: webhook                          #默认接收器为webhook
  group_by: ['equal','level']                #多个告警进行分组
  group_wait: 30s                            #30s内收到的报警在同一条消息中发出
  group_interval: 5m                         #按上面分组的消息,同一组消息,间隔5m才发送下一个。这个是为了尽量避免由一个问题带来的批量告警重复发送
  repeat_interval: 4h                        #完全相同的一个告警消息,间隔repeat_interval时间才下一次发送
  routes:                                   #给webhook接收器定义匹配标签规则
  - receiver: webhook_info
    group_by: ['equal']                      #多个告警进行分组
    group_wait: 30s                           #30s内收到的报警在同一条消息中发出
    group_interval: 5m                        #按上面分组的消息,同一组消息,间隔5m才发送下一个。这个是为了尽量避免由一个问题带来的批量告警重复发送
    repeat_interval: 4h                        #完全相同的一个告警消息,间隔repeat_interval时间才下一次发送
    match:                                        #匹配标签,如果不匹配 返回父级目录
      send: "info"
  - receiver: webhook
    group_by: ['equal','level']               #多个告警进行分组
    group_wait: 30s                            #30s内收到的报警在同一条消息中发出
    group_interval: 10m                        #按上面分组的消息,同一组消息,间隔5m才发送下一个。这个是为了尽量避免由一个问题带来的批量告警重复发送
    repeat_interval: 6h                        #完全相同的一个告警消息,间隔repeat_interval时间才下一次发送
    match:                                     #匹配标签,如果不匹配 返回父级目录
      level: "8"
  - receiver: webhook
    group_by: ['equal','level']                #多个告警进行分组
    group_wait: 30s                            #30s内收到的报警在同一条消息中发出
    group_interval: 10m                        #按上面分组的消息,同一组消息,间隔5m才发送下一个。这个是为了尽量避免由一个问题带来的批量告警重复发送
    repeat_interval: 3h                        #完全相同的一个告警消息,间隔repeat_interval时间才下一次发送
    match:                                        #匹配标签,如果不匹配 返回父级目录
      level: "9"
  - receiver: webhook
    group_by: ['equal','level']                #多个告警进行分组
    group_wait: 30s                            #30s内收到的报警在同一条消息中发出
    group_interval: 5m                         #按上面分组的消息,同一组消息,间隔5m才发送下一个。这个是为了尽量避免由一个问题带来的批量告警重复发送
    repeat_interval: 15m                        #完全相同的一个告警消息,间隔repeat_interval时间才下一次发送
    match:                                      #匹配标签,如果不匹配 返回父级目录
      level: "10"

receivers:
- name: webhook
  webhook_configs:
  - url: 'http://xxxx:8000/cgi-bin/prom.py'
    send_resolved: true
- name: webhook_info
  webhook_configs:
  - url: 'http://xxxx:8000/cgi-bin/prom.py'
    send_resolved: false

inhibit_rules:                               #抑制规则
  - source_match:                            #当存在源标签时抑制含有目标标签的告警
      level: "9"
    target_match:
      level: "8"
    equal: ['equal', 'kubernetes_pod_name']  #保证该配置下标签内容相同才会被抑制
  - source_match:                            #当存在源标签时抑制含有目标标签的告警
      level: "10"
    target_match:
      level: "9"
    equal: ['equal', 'kubernetes_pod_name'] #保证该配置下标签内容相同才会被抑制
附图,job这边我有所删减~ 报警也是暂时搞得~


嗯,这个报警的红绿灯也挺好玩的
grafana有个特别好用的东西!!!!!!!!!!!!!!!!!!!!
安装直接用的官方镜像,记得挂载一个数据盘到grafana的目录, 不然改好的东西重启容器就没了~
yaml奉上~,默认密码应该是admin/admin
---
apiVersion: apps/v1beta2
kind: Deployment
metadata:
  name: grafana
  labels:
    app: grafana
  namespace: monitor
spec:
  replicas: 1
  selector:
    matchLabels:
      app: grafana
  template:
    metadata:
      labels:
        app: grafana
    spec:
      containers:
        - name: grafana
          image: 'grafana/grafana:latest'
          imagePullPolicy: Always
          env:
            - name: GF_AUTH_BASIC_ENABLED
              value: 'true'
            - name: GF_AUTH_ANONYMOUS_ENABLED
              value: 'false'
          resources:
            limits:
              cpu: '1'
              memory: 1024Mi
          volumeMounts:
            - name: volume-1542626660260
              mountPath: /var/lib/grafana
      volumes:
        - name: volume-1542626660260
          persistentVolumeClaim:
            claimName: grafana
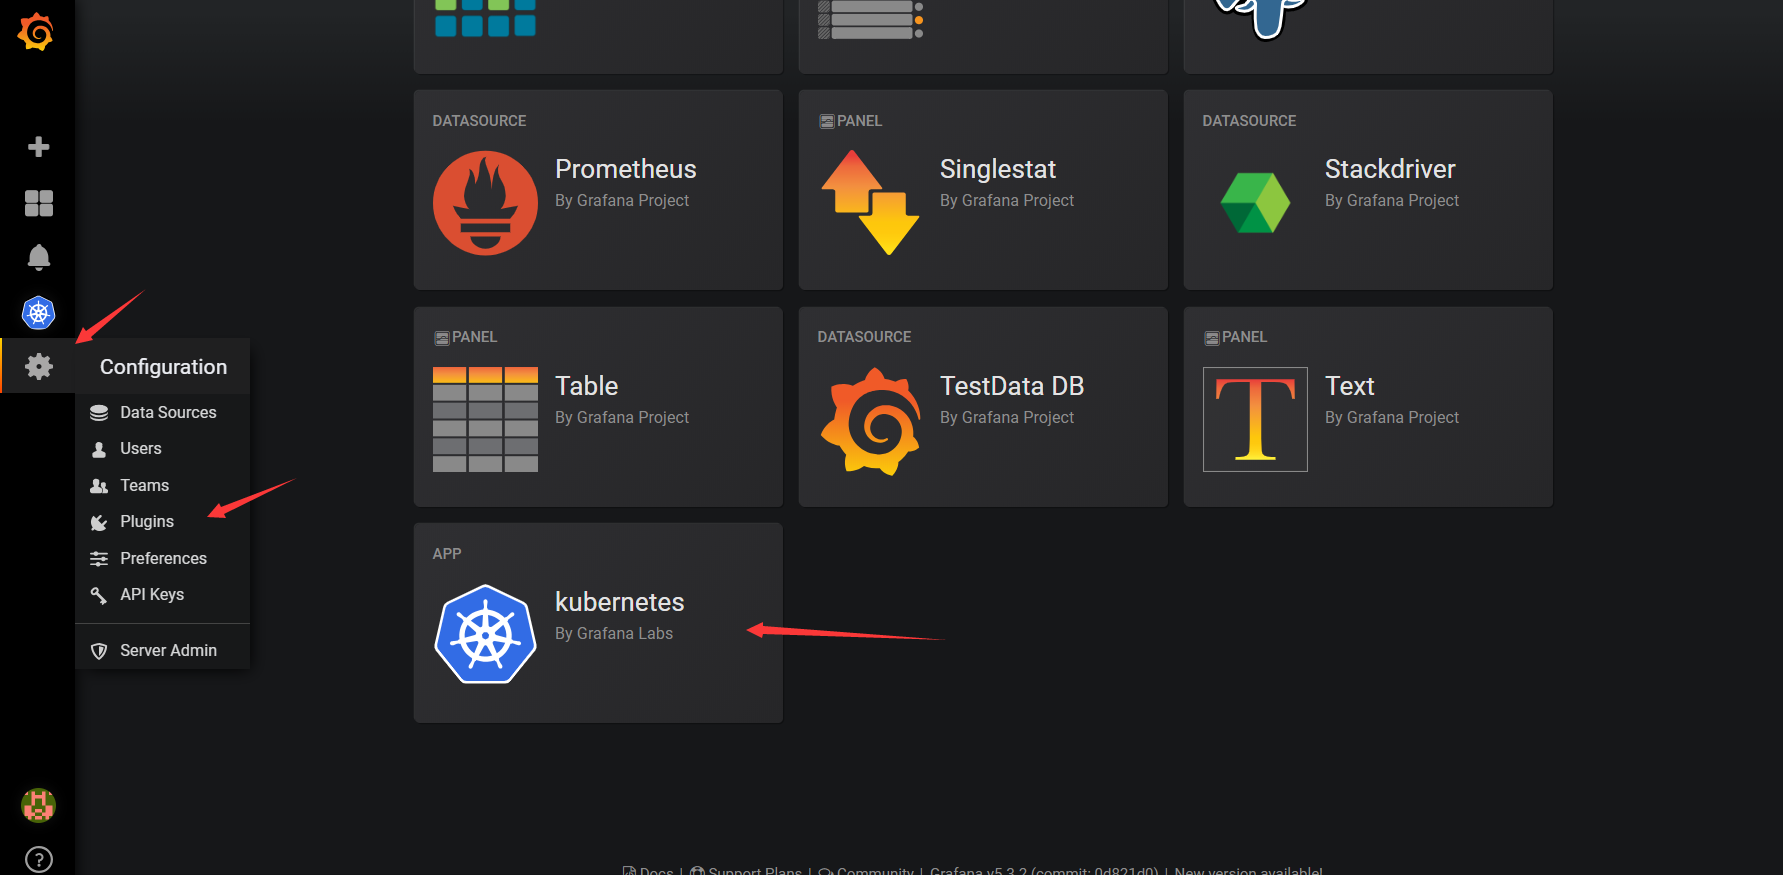
重点来了

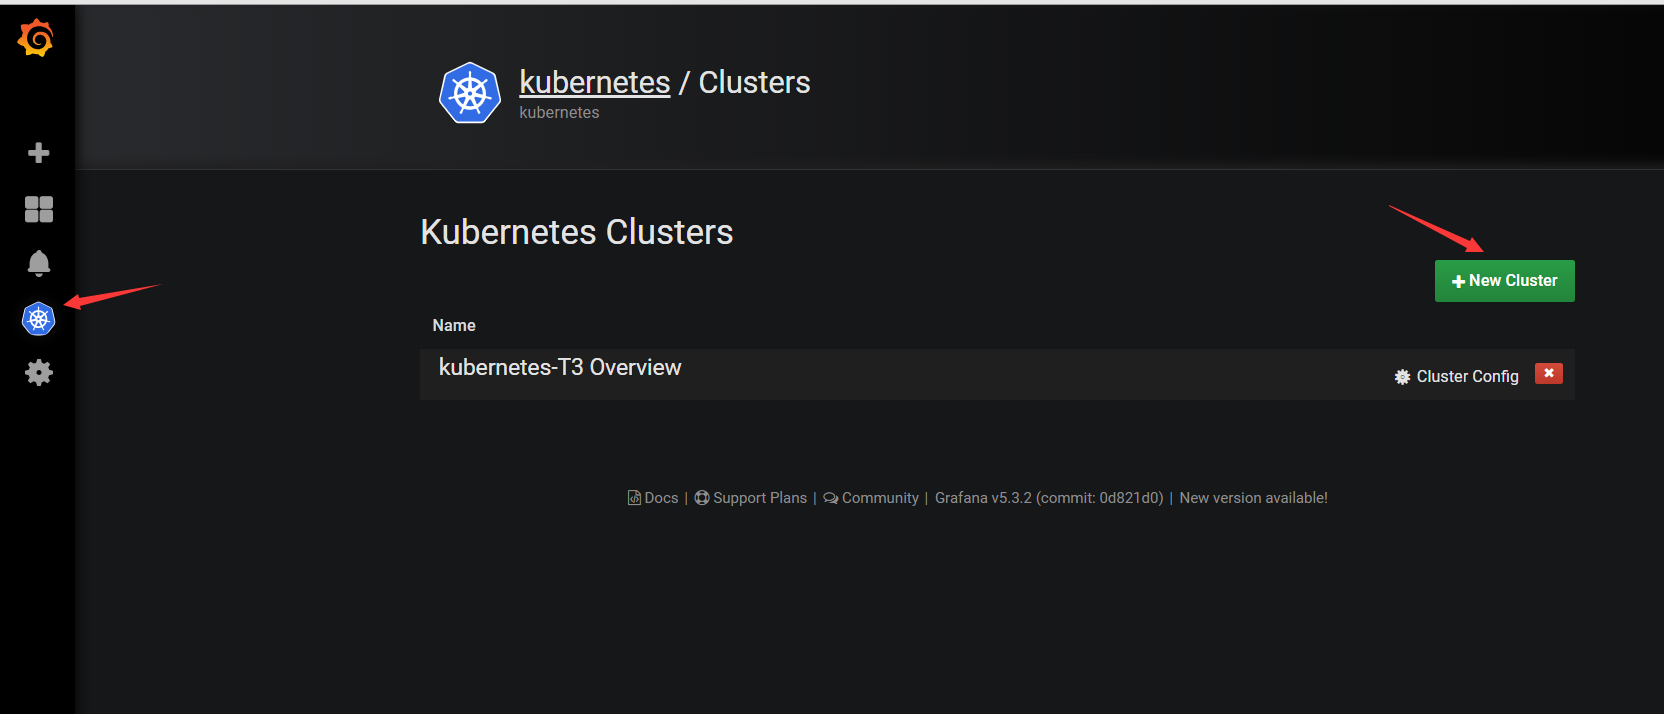
找到kubernetes的插件!然后来安装它
kubectl exec -it grafana-976445f45-2h674 /bin/bash --namespace=monitor
grafana-cli plugins install grafana-kubernetes-app
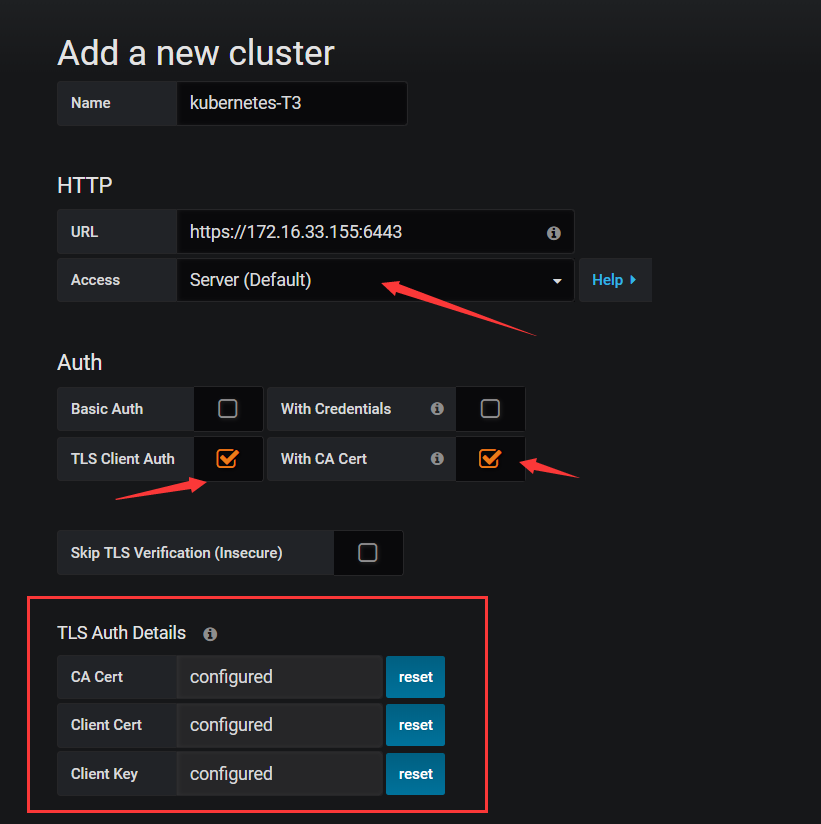
注意红框,是base64的 记得转码!大坑!
echo "证书" |base64 -d
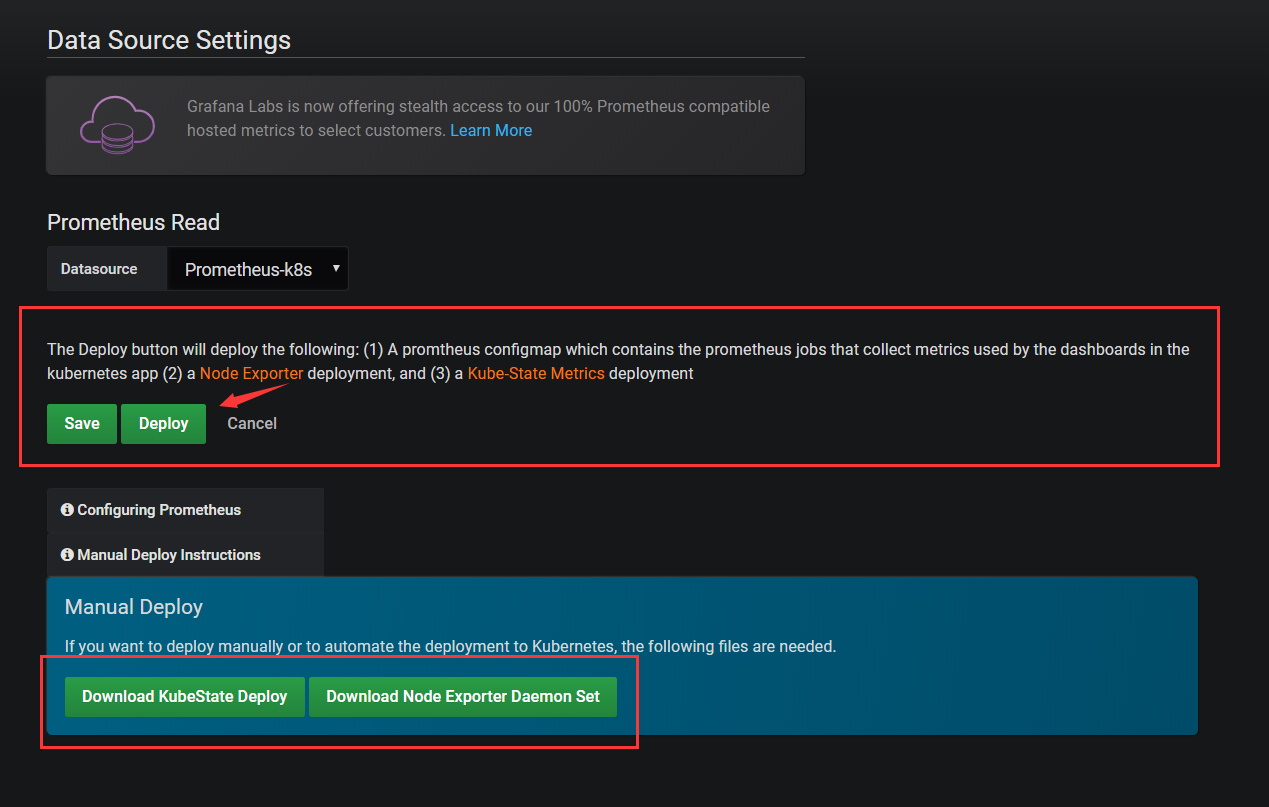
选择Prometheus数据源,注意红框框的东西 上面的是选择deploy 他会帮助你自动部署kube-state-metrics 真的 我强烈推荐这个的,千万别学我手动部署
下面的是手动部署,我还是希望你不要学我,如果真的手动部署,我希望你不要乱换镜像,因为他的监控标签一直在变动,虽然是朝着越来越好的方向变动。。。。。
configuring Prometheus 是Prometheus的两个job 上面已经写在了配置文件里
Manual Deploy Instructions 点开之后 会给你两个json文件
grafanak8s-node-exporter-ds.json grafanak8s-kubestate-deploy.json
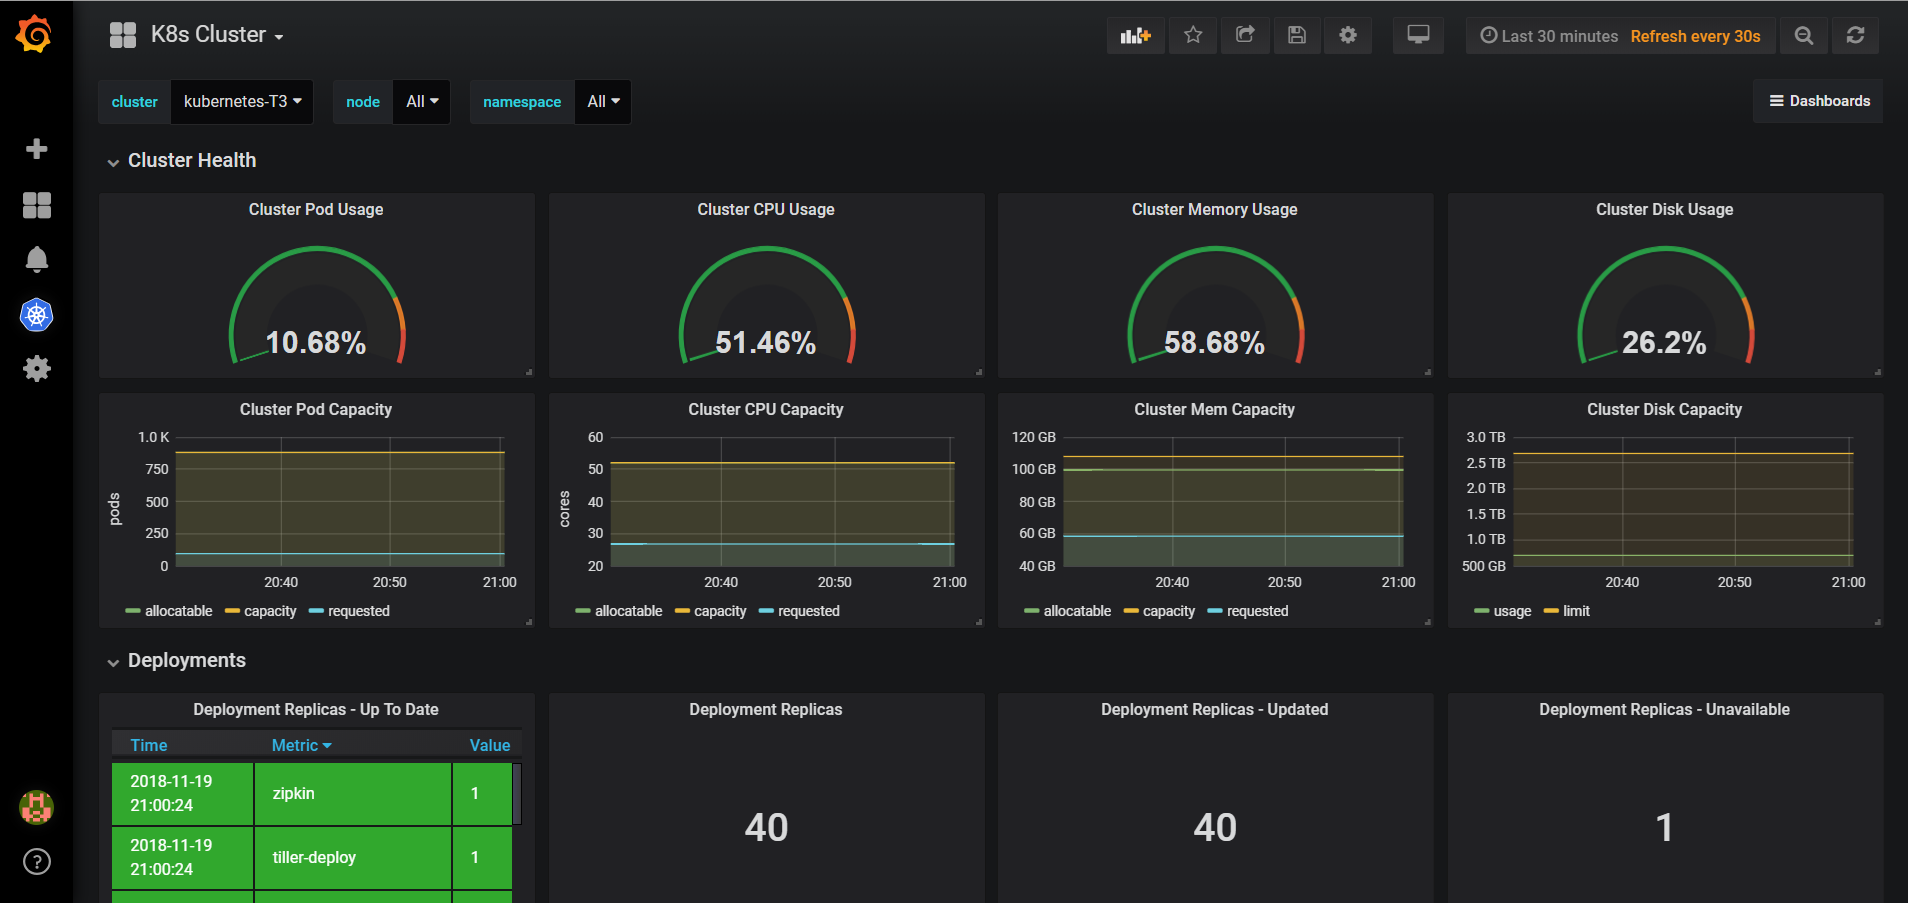
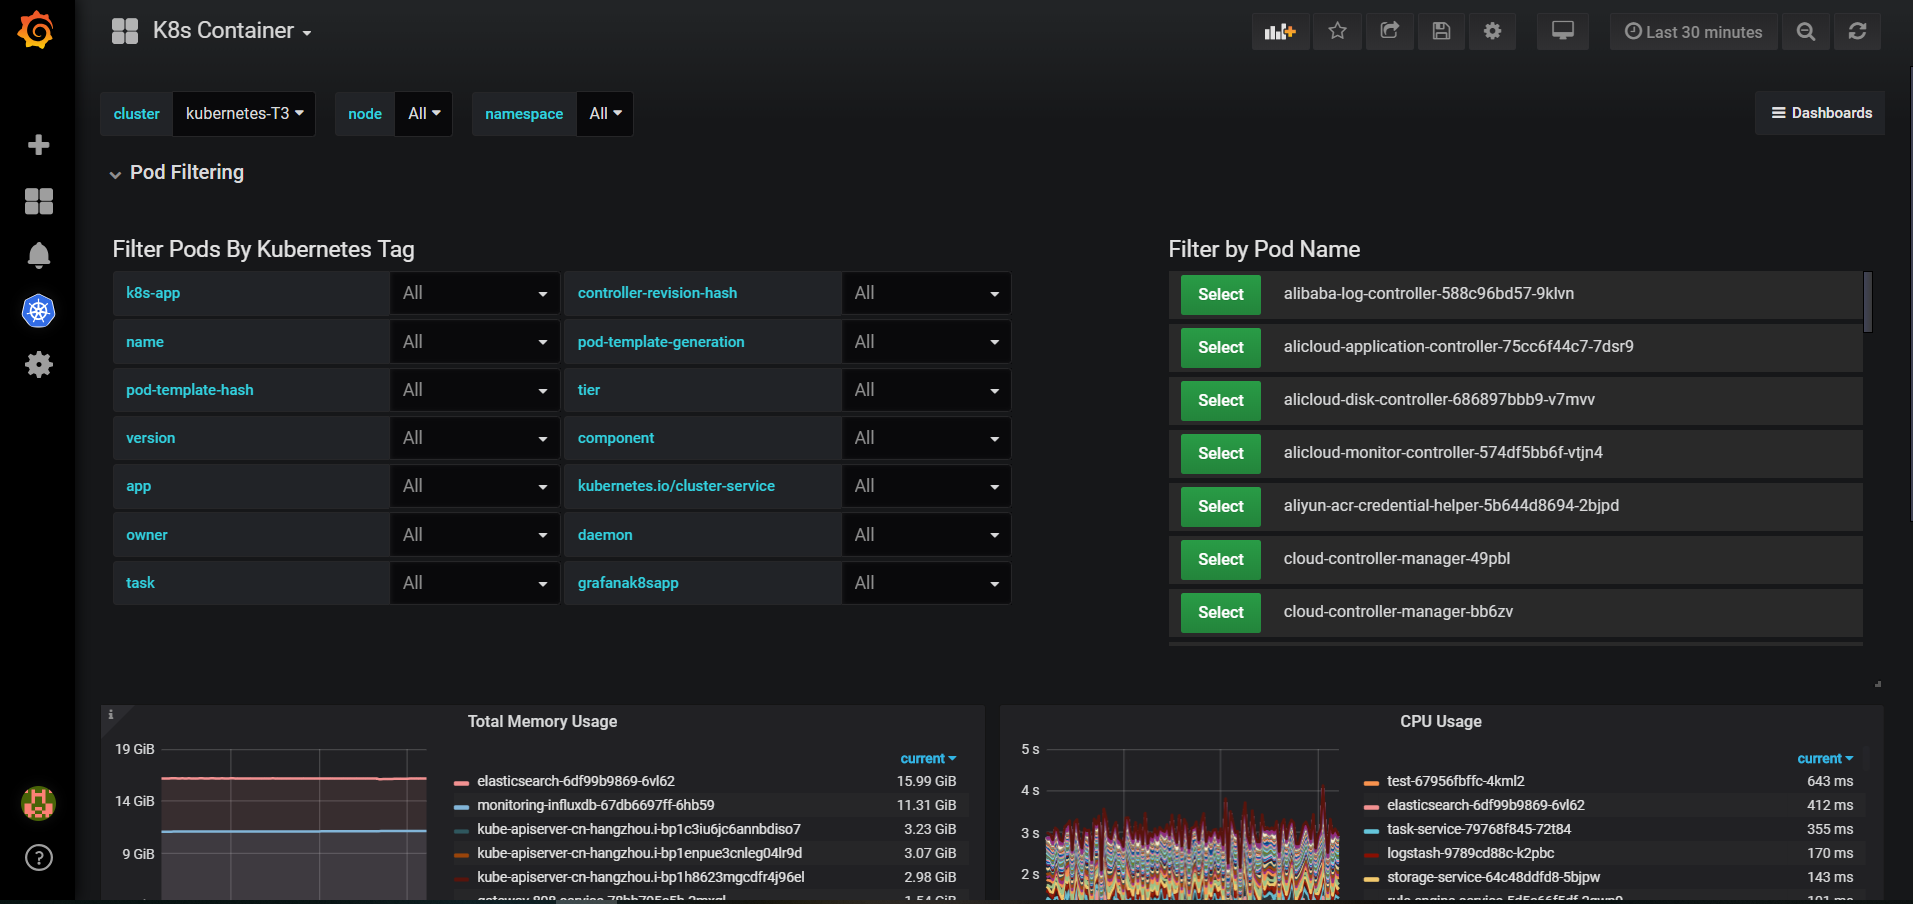
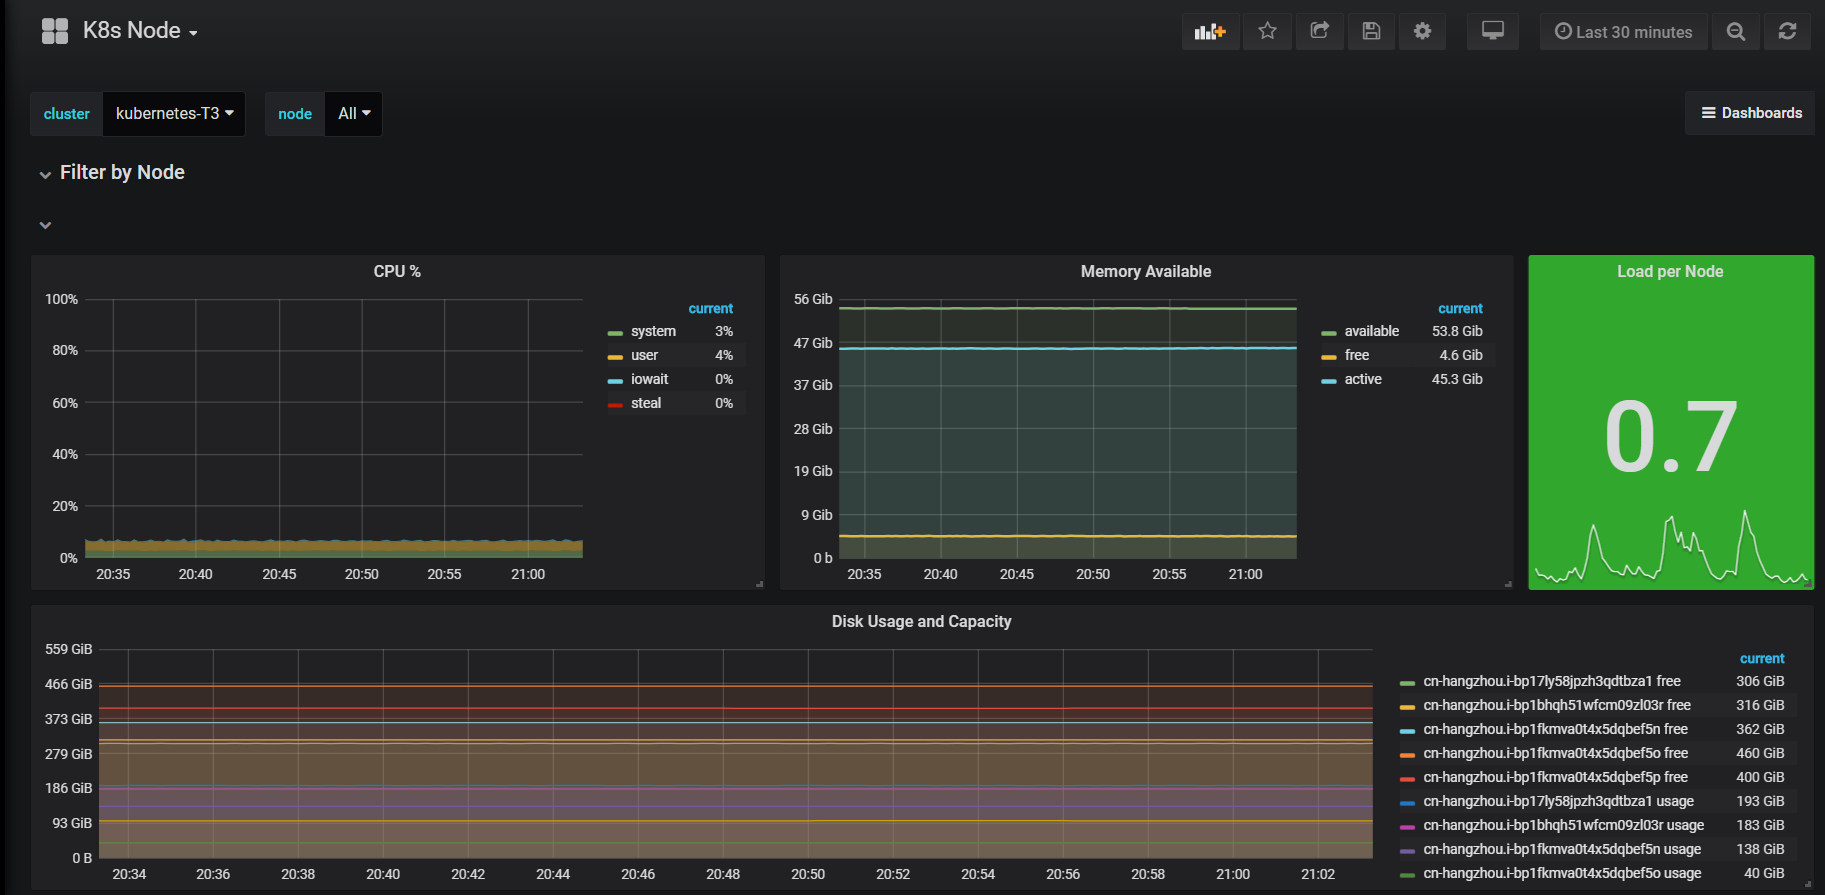
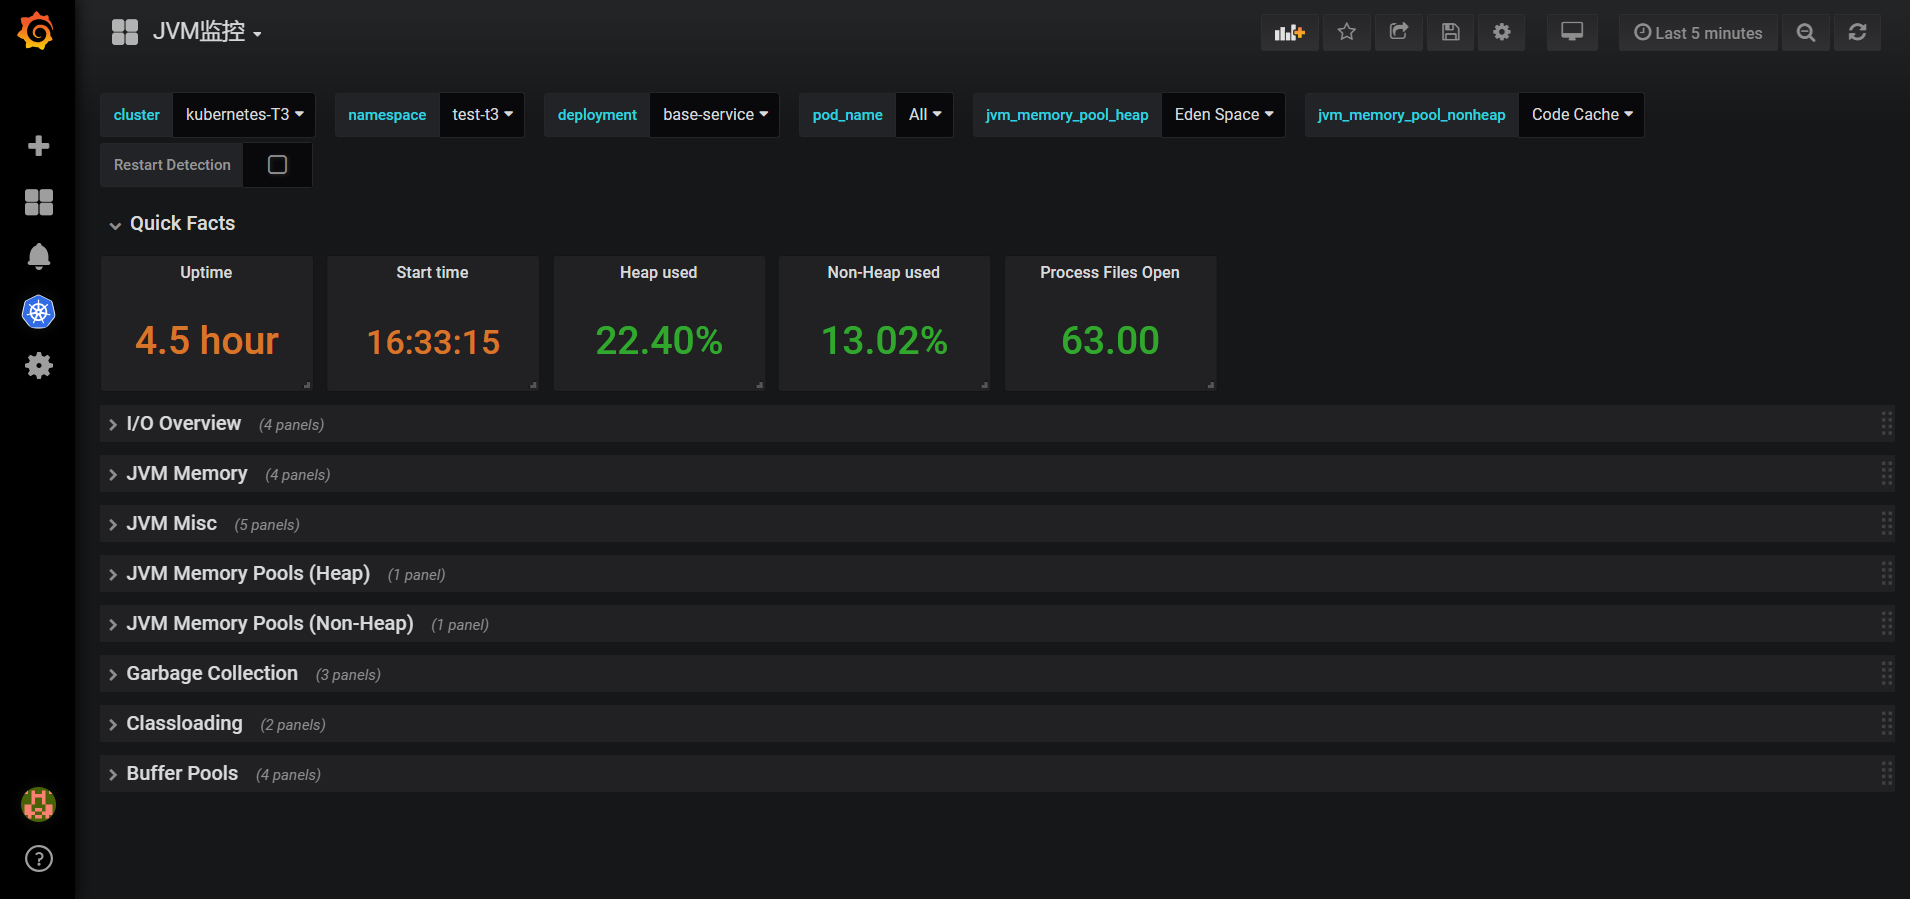
当你 一切都部署好之后 再点开仪表盘 你会有一种很爽的感觉了,附图几张
这里只是记录一下我这两星期遇到的坑,当然有的我也忘了
有人问过我pod重启过,换过node节点,名字也换了 监控这边能不能接上,这是必须可以的
不忘再吐槽一句,Prometheus的官网 示例好少啊- -
Prometheus运算符:传送门
Prometheus查询:传送门
Alertmanager规则:传送门
Prometheus 元数据标签:传送门